By Ujjwal Mishra, CSE 3rd Year
The main motive of this article is to get to know about n-ary search algorithm. Basically how it works and observe the variation in time with each increase in partition of the array. Careful observation of the graph and the optimal use of random functions will play an imperative role in fetching the result. Analysis of the graph will lead to a proper explanation about the behavior of n-ary search algorithm. On the grounds of theory the graph of n-ary search should be parabola but implementing it practically will show it’s actual behavior . Mine main aim is to analyse the behavior of an n-ary search algorithm.
N-ary search is an algorithm to search for a key in a given list of an array. If to find the
key element two partitions are required then it is called Binary Search , Ternary Search if three partitions and so on. In general it is termed as N-ary Search. In n-ary search Divide and Conquer strategy is applied on an array where there is decrease by a fractional factor. It is observed that the Divide And Conquer strategy is beneficial initially but as partitions go on increasing benefit is overshadowed by the number of partitions and as the algorithm proceed towards linear search.To achieve the objective an array of size 90 is created and it is populated with random values using random functions. The main reason behind populating the array randomly is to cover all the bases, the best, the average case and the worst case. A key is generated randomly with the help of random functions in a similar fashion as the array was populated. A counter representing the number of
partitions is setup from 2 to 90. The key is searched about 1000 times for each partition to cover all the possible bases. Time required to find the key is noted for each
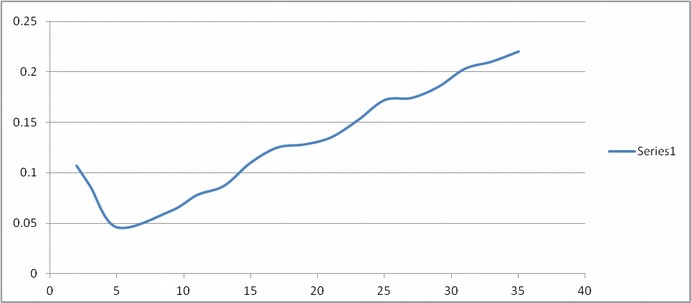
partition. Behavior of the algorithm is depicted by the time-partition graph. Graph is expected to be a parabola according to the theory as initially n-ary search algorithm
proves to be beneficial but after attaining a certain minima it rises as it tends to linear search.The specifications of the system on which the program is executed is as follows:
1) Operating System- Ubuntu(15.04)
2) Processor- Intel I3
3) RAM- 4GB
Expected time-partition graph is as follows
N-ary search is an algorithm to search for a key in a given list of an array. If to find the
key element two partitions are required then it is called Binary Search , Ternary Search if three partitions and so on. In general it is termed as N-ary Search. In n-ary search Divide and Conquer strategy is applied on an array where there is decrease by a fractional factor. It is observed that the Divide And Conquer strategy is beneficial initially but as partitions go on increasing benefit is overshadowed by the number of partitions and as the algorithm proceed towards linear search.To achieve the objective an array of size 90 is created and it is populated with random values using random functions. The main reason behind populating the array randomly is to cover all the bases, the best, the average case and the worst case. A key is generated randomly with the help of random functions in a similar fashion as the array was populated. A counter representing the number of
partitions is setup from 2 to 90. The key is searched about 1000 times for each partition to cover all the possible bases. Time required to find the key is noted for each
partition. Behavior of the algorithm is depicted by the time-partition graph. Graph is expected to be a parabola according to the theory as initially n-ary search algorithm
proves to be beneficial but after attaining a certain minima it rises as it tends to linear search.The specifications of the system on which the program is executed is as follows:
1) Operating System- Ubuntu(15.04)
2) Processor- Intel I3
3) RAM- 4GB
Expected time-partition graph is as follows
But the actual graph comes out to be a bit different. It happens to have some peaks and the inclusion of local minimas couldn’t be ignored. The unusual behavior of the
graph can be credited to the random functions. With proper justification for the anomalies the graph could be justified.
Implementing the problem using the Divide and Conquer strategy depicts the actual behavior of the n-ary search algorithm. The actual results obtained are as follows
graph can be credited to the random functions. With proper justification for the anomalies the graph could be justified.
Implementing the problem using the Divide and Conquer strategy depicts the actual behavior of the n-ary search algorithm. The actual results obtained are as follows
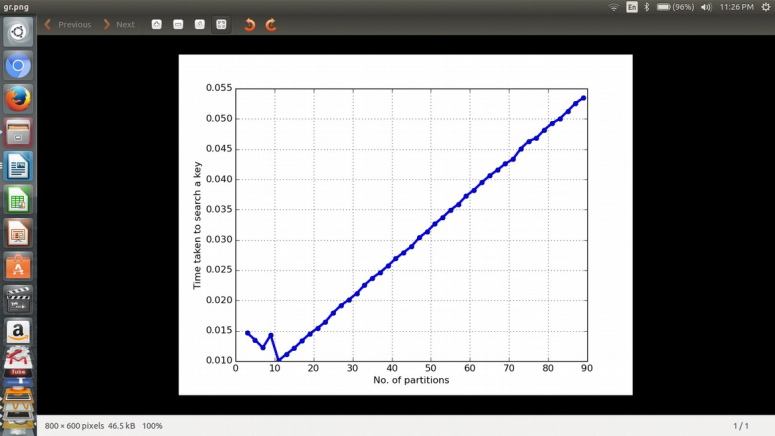
After having a look at the graph and the values it is clear that initially on moving from 3 to 9 the time taken to find the key decreases which is a clear indication that the n-ary
algorithm is beneficial for a small number of partitions. Suddenly a peak can be observed at 9 and then a sudden dip at 10 and it remains the least value. So 10 is the
minima in this case. After 10 there is a steep incerase in time implying benefits of the divide and conquer strategy is overshdowed by the increase in the number of partition of
the array. Consequently it will be tending towards the linear search strategy.
The main reason behind the ambiguities observed in the graph is the random function. As the name suggests it randomly generates the key so it may be the case that the
key generated by the random function at 9 partitions falls in the worst case and thus it takes a bit longer than the previous case. Along with the role of the random function
the processes running on the system at the time of execution may also contribute to this ambiguity.
From the graph a clear conclusion can be made. Since the time taken to search the key decreases initially it can be concluded that the divide and conquer strategy is
beneficial as smaller portion of an array is to be solved but this benefit is attained up to a particular extent . After the threshold dividing the array in further smaller parts instead
of benefiting proves out to be costly as dividing the array in much smaller parts will at last lead to partition of single element which is just a case of linear search.
